
Liquidity as Infrastructure in Emerging Markets
by Gravity Team
Financial inclusion is often framed as “access to an account,” but in practice it is “access to reliable financial outcomes”: the ability to store value, convert currencies, make time-sensitive payments and hedge local volatility at a cost ordinary households and SMEs can afford. In emerging markets, those outcomes are frequently constrained by foreign exchange (FX) frictions, high remittance fees, a shallow local capital market and uneven payment rails. The result is a familiar pattern: remittances are large and persistent, yet moving $200 still costs a meaningful share of income for many recipients, and dollar access during stress becomes a “liquidity” problem as much as a “policy” problem. Global remittance costs averaged 6.49% in early 2025, far above the SDG target of 3%.
From an LP’s perspective, the most underappreciated lever for inclusion is liquidity engineering: tighter spreads, deeper order books and reliable stablecoin inventory across fiat corridors. When liquidity is thin, users pay in three ways: wider bid–ask spreads, more slippage on larger orders, and higher “basis” costs when markets must be hedged across venues and time. In contrast, robust liquidity turns stablecoins and crypto rails from speculative instruments into practical financial infrastructure, particularly for:
Remittances and payroll
SME cross-border procurement
Household “synthetic USD” savings during inflation episodes.
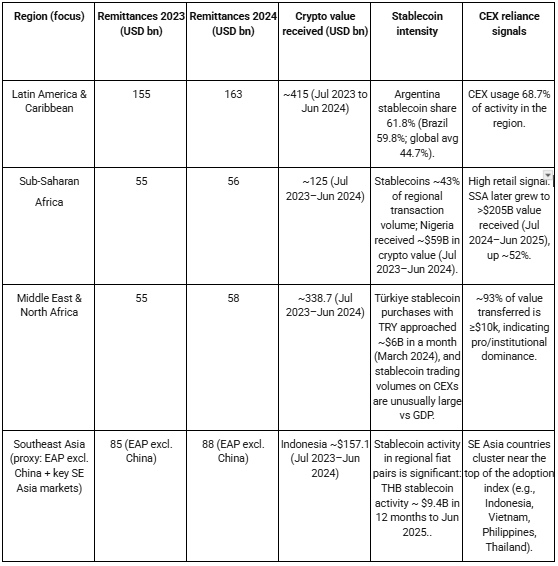
The 2025 data show why this matters now. Remittance inflows into emerging markets remain structurally large in 2025. Latin America and the Caribbean continue to receive over $160B annually, Sub-Saharan Africa over $55B, and MENA close to $60B, reinforcing the importance of efficient cross-border value transfer infrastructure. Crypto usage across emerging markets remains substantial in 2025, with hundreds of billions of dollars in annual value received across regions such as Latin America, MENA, and Sub-Saharan Africa, according to recent Chainalysis methodology. These figures should be interpreted as throughput proxies rather than direct on-ramp volumes. Stablecoins have become central in several of these markets. Stablecoins account for a material share of transaction volume in emerging markets, often exceeding global averages. In markets such as Sub-Saharan Africa and Argentina, stablecoin usage reflects practical demand for dollar-denominated liquidity rather than speculative activity. This creates a concrete mandate for liquidity providers: build “always-on” conversion capacity between local fiat, stablecoins and majors under tight compliance constraints that vary sharply across jurisdictions (notably AML/CFT and Travel Rule implementation gaps).
What “inclusion” means
Two inclusion benchmarks matter for liquidity providers:
Global account ownership continues to rise, with recent World Bank updates indicating ~79% of adults globally have access to an account, reflecting steady progress from prior Global Findex benchmarks. However, gaps remain, particularly in Sub-Saharan Africa, where access is still significantly lower.
Financial outcomes: the ability to convert and move money cheaply. Here, remittance costs are a high-signal proxy. In Q1 2025, the global average cost of sending $200 was 6.49%.
For market makers, “financial inclusion” therefore becomes measurable as: (a) the cost of immediacy (spread + slippage) to go from local fiat - stablecoin - local fiat, (b) reliability of execution under stress, and (c) compliance-safe connectivity to banking/payment rails that keep that conversion legal and durable.
Liquidity as the missing layer between stablecoins and real-world usage
Stablecoins reduce the volatility of assets in payments and savings, but they do not automatically solve the execution problem. Users still need to acquire and dispose of stablecoins at predictable pricing. When this conversion is unreliable, stablecoins behave like “walled-garden dollars,” accessible only at punitive spreads, or only through informal channels. This is why the liquidity provider’s role is foundational: market makers are effectively the “FX desk” for the digital dollar economy in corridors where bank FX is expensive or slow.
In 2025, the constraint is no longer access to stablecoins, but access to reliable conversion between fiat and digital dollars at scale. This shifts the inclusion problem from distribution to execution quality, where liquidity providers play a central role.
The macro backdrop supports this framing. Recent BIS analysis highlights that cross-border crypto and stablecoin flows remain structurally significant, with stablecoins accounting for a large share of transaction volume and showing strong correlation with regions where traditional remittance costs are high. In parallel, the IMF’s stablecoin research emphasises that stablecoin cross-border flows have become sizable and that stablecoin usage patterns vary widely by region; it also estimates cross-border stablecoin payment flows on the order of about $1.5T in a recent measurement frame, with EMDE corridors featuring prominently.
For a market maker, these findings translate into an operational thesis: liquidity is the control surface that determines whether “stablecoin adoption” expresses as consumer benefit (lower costs, faster settlement) or as rent extraction (wide spreads, fragile access).
Assumptions and gaps: “crypto value received” is sourced from Chainalysis regional methodology and is best interpreted as a throughput proxy (on-/off-chain and service-based attribution), not a direct measure of consumer “on-ramp volume” at the payment-rail level. Public, corridor-level fiat on-ramp volumes are rarely disclosed by banks/processors; where local-fiat stablecoin purchase values are mentioned (e.g., TRY, THB), they reflect market activity on trading venues and are not identical to remittance-specific flows.
Measuring impact: KPIs that a liquidity provider can realistically move
A practical inclusion scorecard should be execution and corridor-based:
Effective conversion cost (fiat - stablecoin - fiat): spread + slippage + explicit fees. Spread is formally measurable at the top-of-book and over time windows.
Depth near market price: for major hedges, global order books can be deep (e.g., BTC depth within ±$100 totalling ~$20–$25M per side across leading exchanges in a CoinGecko sample). The analogous metric for EM fiat pairs is the key bottleneck, often not publicly available, which is why internal measurement and selective disclosure can differentiate market makers in emerging markets.
Remittance affordability proxy: global remittance costs remain elevated (6.49% average cost to send $200). Where stablecoin corridors can be executed at materially lower all-in costs, the delta is a measurable inclusion gain, especially for high-frequency, low-ticket transfers.
Volatility transmission and stress behaviour: monitor (i) stablecoin peg deviations, (ii) local-fiat premium/discount versus USD benchmark, and (iii) corridor liquidity withdrawal during shocks. Macro research shows stablecoin usage and flows have region-specific patterns and can scale into meaningful cross-border volumes.